Focus Fanatics Forum banner

Myth Busters - MPG Trend Over Time

4.9K views 35 replies 16 participants last post by  kam327  
#1 ·
Decided on this slow afternoon at work to put to the test the claims by a few on here that MPG will increase dramatically (i.e. more than 5 mpg) after the break in period. I'll admit I was very curious myself as mine has gone up only 1-2 mpg over 3,000 miles.

I went on Fuelly and downloaded the data of the first 10 2012 Focus owners I found with at least 30 fillups, meaning they're probably approaching 10,000 miles.

I made sure to start with the first fill up they entered, which I assume is very soon after they bought the car new. And I went up to the first 50 fill ups if they had more than 50.

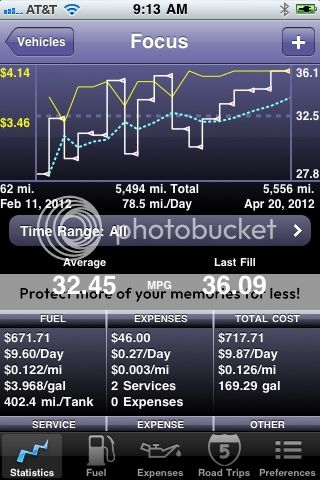
Here is a graph of what I found. Pay no attention to the spaghetti, but look at the straight lines which are the linear trendlines through each set of raw data. You will see that in this relatively small sample MPG increased in the long term by an maximum of 3 mpg. The other folks whose MPG trended upward saw maybe 1-2 mpg increase.

But the majority in this sample, 6 out of 10, actually saw their MPG go DOWN over the long term, by as much as 4mpg!

Anyway, look for yourselves. I realize this is nowhere near statistically significant and will think about spending more time on this to add data sets in the near future.

Image
 
#3 ·
True, but all I'm looking for is the long term trend. Shouldn't matter if they're city or highway drivers. City drivers' mileage will vary more widely on a given tank but over 40 tanks or more the short term variance will disappear and we'll see over the long term if their mileage is trending up, down or steady.
 
#4 ·
I agree with TiGero. Thanks for all the work, but I'm not sure how good the data are if you have no idea what the driving trends were for each of these vehicles. i.e., city vs. highway driving.
 
#8 ·
It doesn't matter what their driving habits are, as long as each stays relatively consistent. Yes, I'm assuming that someone didn't do mostly highway driving for the first 20 tanks and then completely switch to city driving for the next 20 tanks, which would artificially trend their MPG down. These graphs are intended to give a glimpse into the perfomance of each car assuming they're driven by the same person in relatively consistent driving condtions (meaning mostly city, mostly highway, or mostly mixed). Even a couple of tanks of pure highway when the driver otherwise drives all mixed is not going to have a significant "pull" effect on the trendline.
 
#6 ·
Great idea! Also, I'm sorry my winter tires are messing up your statistics! haha

Image


Jesus... there seems to be no rhyme or reason to my gas mileage trends... it'd be a fun roller coaster, though. My worst mileage was 28.11mpg - and that's because my mom left my car running for an hour one morning so that it could "warm up" >_>

EDIT: I also didn't track my mileage when I first got my car... first time I tracked it on fuelly it was already at 2,912 miles...
 
#9 ·
that graph is really hard to read.

I looked at my fuelly, and my first tank fuelly tank, which was after a 1000 miles on the car was 29.73, my 2nd tank was 32.80, my 3rd 29.45 my 4th 31.18. The up and down trend continued but never varied much and i am at 11,500 miles now. So mine didnt improve much except from the first tank when I had only 24 and the second tank of 27.
 
#14 ·
I see where you're going, and it's neat data to look at.

I would also want to know at what mileage each of their trends started so I knew with certainty that they were in the break-in period. In the first graph, I see more downward trends than I do upwards, as you stated.
 
#15 ·
Hey, I just wanna say that I'm not trying to poop all over your work here. Like I said, it's very interesting and appreciate you putting it together.

I'm a natural cynic. [cool]
 
#16 ·
I'm thinking another variable could be climate. Cold vs warm etc. 10000 miles would be likely to start in one and end in the other. I noticed a few MPH as it warmed up. Just sayin'.
 
#18 ·
True. Climate would probably be the biggest factor. My MPG dropped about 3-4MPG during the winter. Now that it's getting warmer. Those numbers should start going up again.

Actually, that would be almost completely irrelevant. The "trend" is what we're looking for here, not the actual MPG. Percentage increase or decrease over time is the only important thing.
Yeah, im getting what kam327 is saying now, but I still think that more factors affect how each persons trend changes.
 
#20 ·
Kam ... this analysis is probably just what any high powered research firm would come up with. I did a lot of surveys when I was working at a newspaper and most of the time came up very close results using random selections from a monster data base. Myth busters is right on.

I never got a bit of a kick out of my milage over the 6000 miles we had the car ...
there were months when the around town milage just hung in same, same week after week. now is a touch better with the new clutch ... dct ... duh ... but starting to creap back to the average before the new clutch ... possibly because whatever the new clutch did is wearing off ...
 
#23 ·
Kam ... this analysis is probably just what any high powered research firm would come up with. I did a lot of surveys when I was working at a newspaper and most of the time came up very close results using random selections from a monster data base. Myth busters is right on.
Ha ha, thanks man. Finally my marketing classes from business school years ago are coming into use!
 
#21 ·
I had a thought. Why don't we start the graph the day the car was bought(or sometime close) and end it in the 4th month, then make the same graph a year later with the same time frame. That way we could eliminate the weather factor and get more accurate results.
 
#22 ·
All good comments guys. I'll take another look at the raw data and see if it can be massaged a little in accordance with your comments. I'm all for seeking a more reliable truth.


I see where you're going, and it's neat data to look at.

I would also want to know at what mileage each of their trends started so I knew with certainty that they were in the break-in period. In the first graph, I see more downward trends than I do upwards, as you stated.

I don't think fuelly.com gives us the actual miles on the car but I'll double check.

Sample size is far, far to small to get a statistically significant trend from the data
I admitted as much, but if 15 of the 20 are showing pretty much the same thing I'm convinced.


Hey, I just wanna say that I'm not trying to poop all over your work here. Like I said, it's very interesting and appreciate you putting it together.

I'm a natural cynic. [cool]
Thanks man, I appreciate it. I tend to play devil's advocate on other people too.
 
#26 ·
Here are revised versions of the graphs.

In fuelly each mpg calc is accompanied by the % city driving on that tank, where the user posts it. I went through that data and eliminated tanks where the quoted % city was more than 20% away from the driver's overall average. So if someone averaged 45% city driving while owning the car, I deleted any data associated with less than 25% city or more than 65% city. That will help minimize the effects of different driving conditions (i.e. city vs highway).

Not surprisingly, I didn't have to delete that much data at all because most folks are pretty consistent.

I also replaced 4 drivers with others because they didn't list what % city each tank was.

I can't confirm that tank 1 for each of these drivers was their first tank since new. But logic says that with 30-70 tanks under their belts, the first 1 had to be pretty close to the first, if not the first. Most of these drivers' data starts in May, June or July of last year.

Finally I faded out the "spaghetti" to make the trendlines easier to see.

Not much has changed:

1 driver increased a huge 13mpg
4 drivers increased a modest 2-4 mpg
8 drivers remained flat
7 drivers decreased a modest 1-3 mpg

Enjoy and take what you want from it. It tells me that MPG is unlikely to change much from new for most folks. I know some have reported larger gains. There are always exceptions.

Image


Image
 
#29 ·
Here are revised versions of the graphs.

In fuelly each mpg calc is accompanied by the % city driving on that tank, where the user posts it. I went through that data and eliminated tanks where the quoted % city was more than 20% away from the driver's overall average. So if someone averaged 45% city driving while owning the car, I deleted any data associated with less than 25% city or more than 65% city. That will help minimize the effects of different driving conditions (i.e. city vs highway).

Not surprisingly, I didn't have to delete that much data at all because most folks are pretty consistent.

I also replaced 4 drivers with others because they didn't list what % city each tank was.

I can't confirm that tank 1 for each of these drivers was their first tank since new. But logic says that with 30-70 tanks under their belts, the first 1 had to be pretty close to the first, if not the first. Most of these drivers' data starts in May, June or July of last year.

Finally I faded out the "spaghetti" to make the trendlines easier to see.

Not much has changed:

1 driver increased a huge 13mpg
4 drivers increased a modest 2-4 mpg
8 drivers remained flat
7 drivers decreased a modest 1-3 mpg

Enjoy and take what you want from it. It tells me that MPG is unlikely to change much from new for most folks. I know some have reported larger gains. There are always exceptions.
Kudos to you for the effort. While it may not stand peer review scrutiny for validity or reliability, it establishes far more basis for sound reasoning than the subjective, "You'll get a lot better mpg after the break in...".
 
#27 ·
Just some food for thought; maybe this graph isn't as accurate in the classical sense. While it may portray a drop in mpg over time, i don't think it's actually because the engine has become worse or its efficiency is decreasing.

Rather, I think it's the novelty, or idea of high mpg's fading. For instance, when i first got my car, i tried everything i could possibly do within reason to hit and beat the estimated mpg rating. And for a car as sensitive as this, (a drop in 10 degrees fahrenheit, a slight drizzle, a head on breeze, a difference in 5mph, could decrease your avg mpg of ~40 to sub ~35 levels [highway of course]) i really tried hard to watch for any of these factors. After about 4 months, I just stopped caring--the novelty wore off. Screw it i said, i knows it gets good mpgs, now i'm going to drive it @ 70+. It could very well be that the graphs show that transition.

Edit:

As for the increase in efficiency for some of the drivers, they may have figured out how their driving habits affect the car's performance, and/or may have changed their habits to get better mileage. Maybe their driving routine has changed as well (I was totally joyriding for the first few weeks of owning the car... not so much anymore). Lots and lots of factors, especially on a car like this.
 
#31 ·
Thats pretty interesting data. I have found that my mpg has been increasing. But as noted there could be two things with that, I got the car this past Feb and the last few tanks I have only been doing 65 instead of 68 to 72 on the highway. I would say most of my driving is highway. the last two or three tanks I have broken 400 miles to the tank, but again had a bit more highway driving then before.

Looking at the graph I know the first two low points, besides the very first fill up, where Stop and Shop gas, where as every other tank has been Mobil.

As another point of interest, I wonder how many have ethanol in the gas and what percent, would be interesting to see how that plays into things.

Image
 
#32 ·
Thanks for the addition. Yeah admittedly there are all sorts of things that could be skewing the data. Probably number one is that we're just coming out of the winter season so that could've skewed the more recent data down a bit (winter blend gas). I'm thinking in July I'll do a July '11 to July '12 graph with a polynomial trend line to see if we can see the effects of the winter season.

By the way, I had a '99 Contour Sport for 6 years. I wish I could go back in time and drive it new again to compare it to the Focus. Would probably still compare well in handling and power. I remember that 2.5L V6 being silky smooth. Of course the 4-speed killed economy - 24 or so overall and the most I could get on a highway trip was 27.
 
#34 ·
It is also entirely possible that one or more of these cars belong to a parent whose child came of driving age during this span and shared the car, or the opposite shared at the beginning then got their own car. All variables need to be accounted for to be scientific or at least kind of accurate. You've compiled some interesting numbers but without all extraneous variables factored in or out. That is all they are.
 
#36 ·
All variables need to be accounted for to be scientific or at least kind of accurate. You've compiled some interesting numbers but without all extraneous variables factored in or out. That is all they are.
That's all they're meant to be since that's all that's possible with the fuelly data. Everyone's free to interpret them as they like. [cheers]